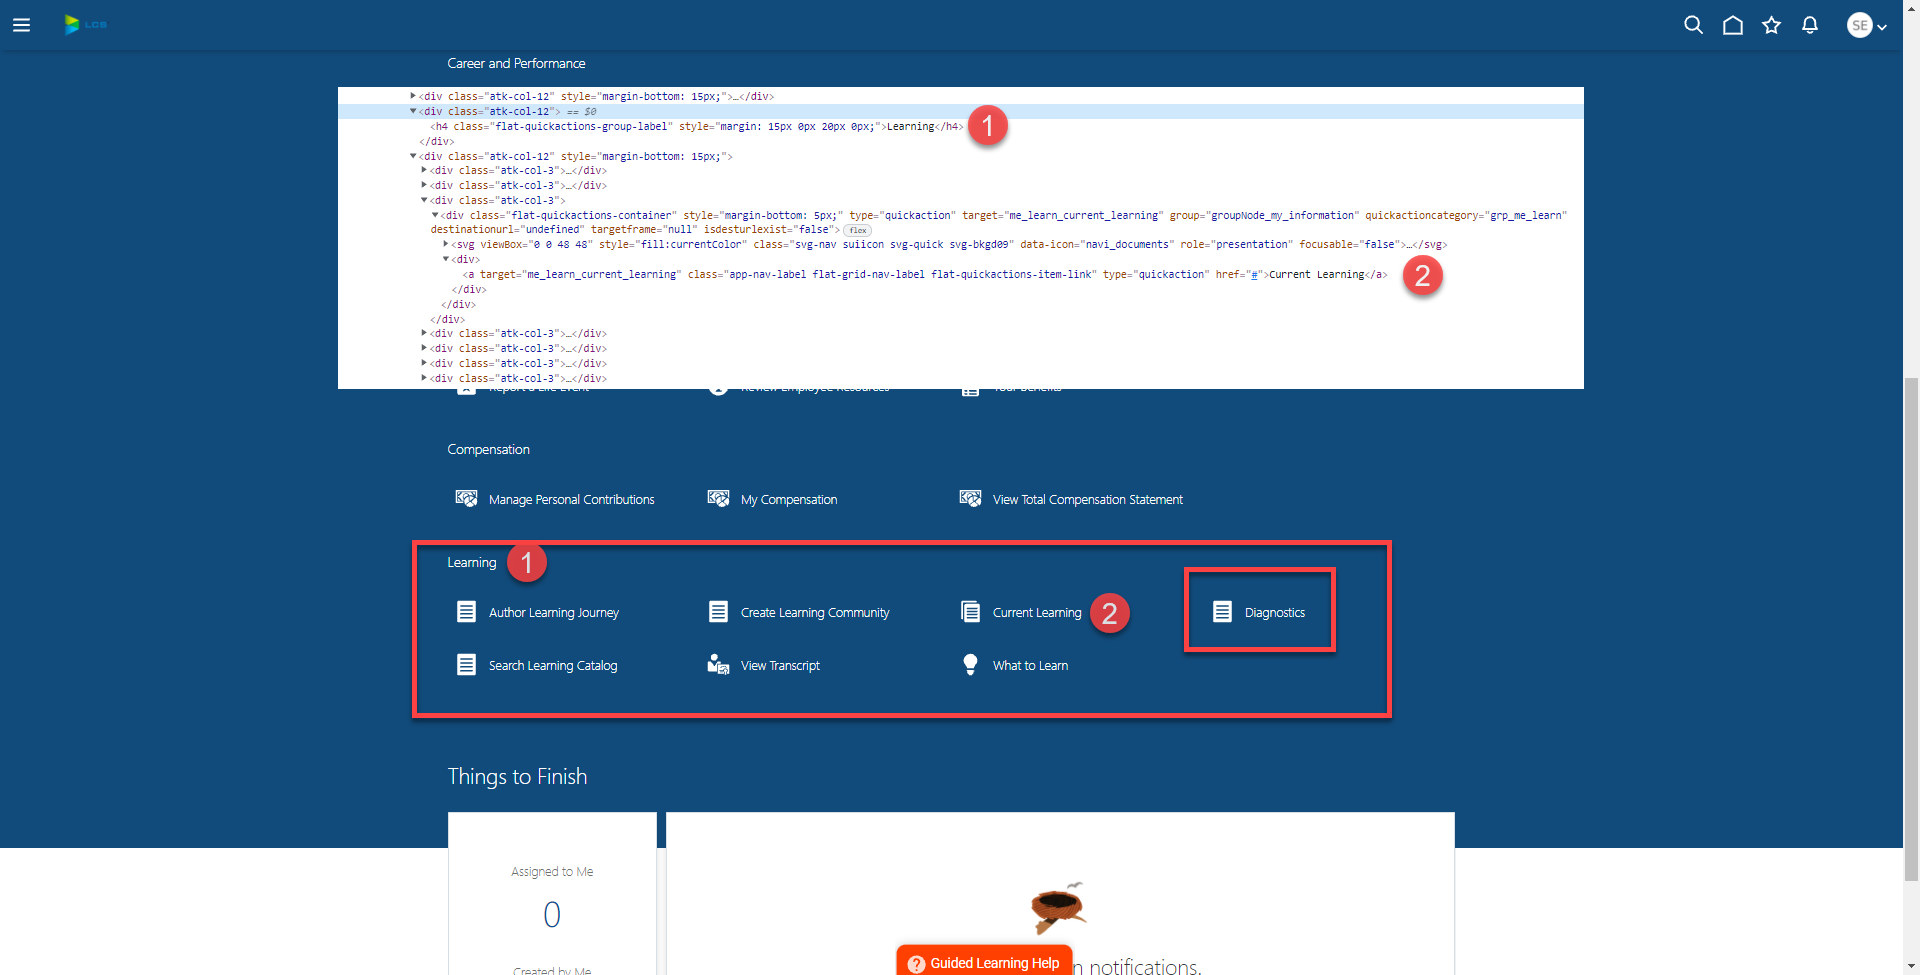
I’m testing user security in our enterprise application (Oracle HCM) and my test case simply looks for multiple text values to confirm they are present. I’m having issues with a handful of text strings not populating in the spy object recorder and during test automation, both with the chrome window open and headless. Below are screen shots for more context. When logged in to Chrome (outside of the Katalon tool), you’ll notice that “Diagnostics” is visible, but within the object spy (and when executing the test), it does not render this text! Anyone experienced this before to know what might be going on here and how to resolve? Does Katalon not use the same browser as my computer’s default browser? Would that have anything to do with this?
Shows outside of Katalon:
Does not show in spy object or during execution:
At that point in the test code, stop the test and inspect the dom.
-
Is the element there but invisible for some reason?
-
What happens if you resize the browser?
-
What happens if you refresh the page – hit Ctrl+F5 ?
@Russ_Thomas
Unfortunately none of those suggestions work. I inspected all elements underneath the Learning header, resized browser multiple times and refresh didn’t generate the object.
Any errors in the browser’s console?
Is that what you see when the page is loaded by hand? Or is that what it looks like when you open the page via Katalon?
What happens if you try Firefox?
Also, please post the nearby HTML – might show us something.
@Brandon_Hein – care to take a look at this?
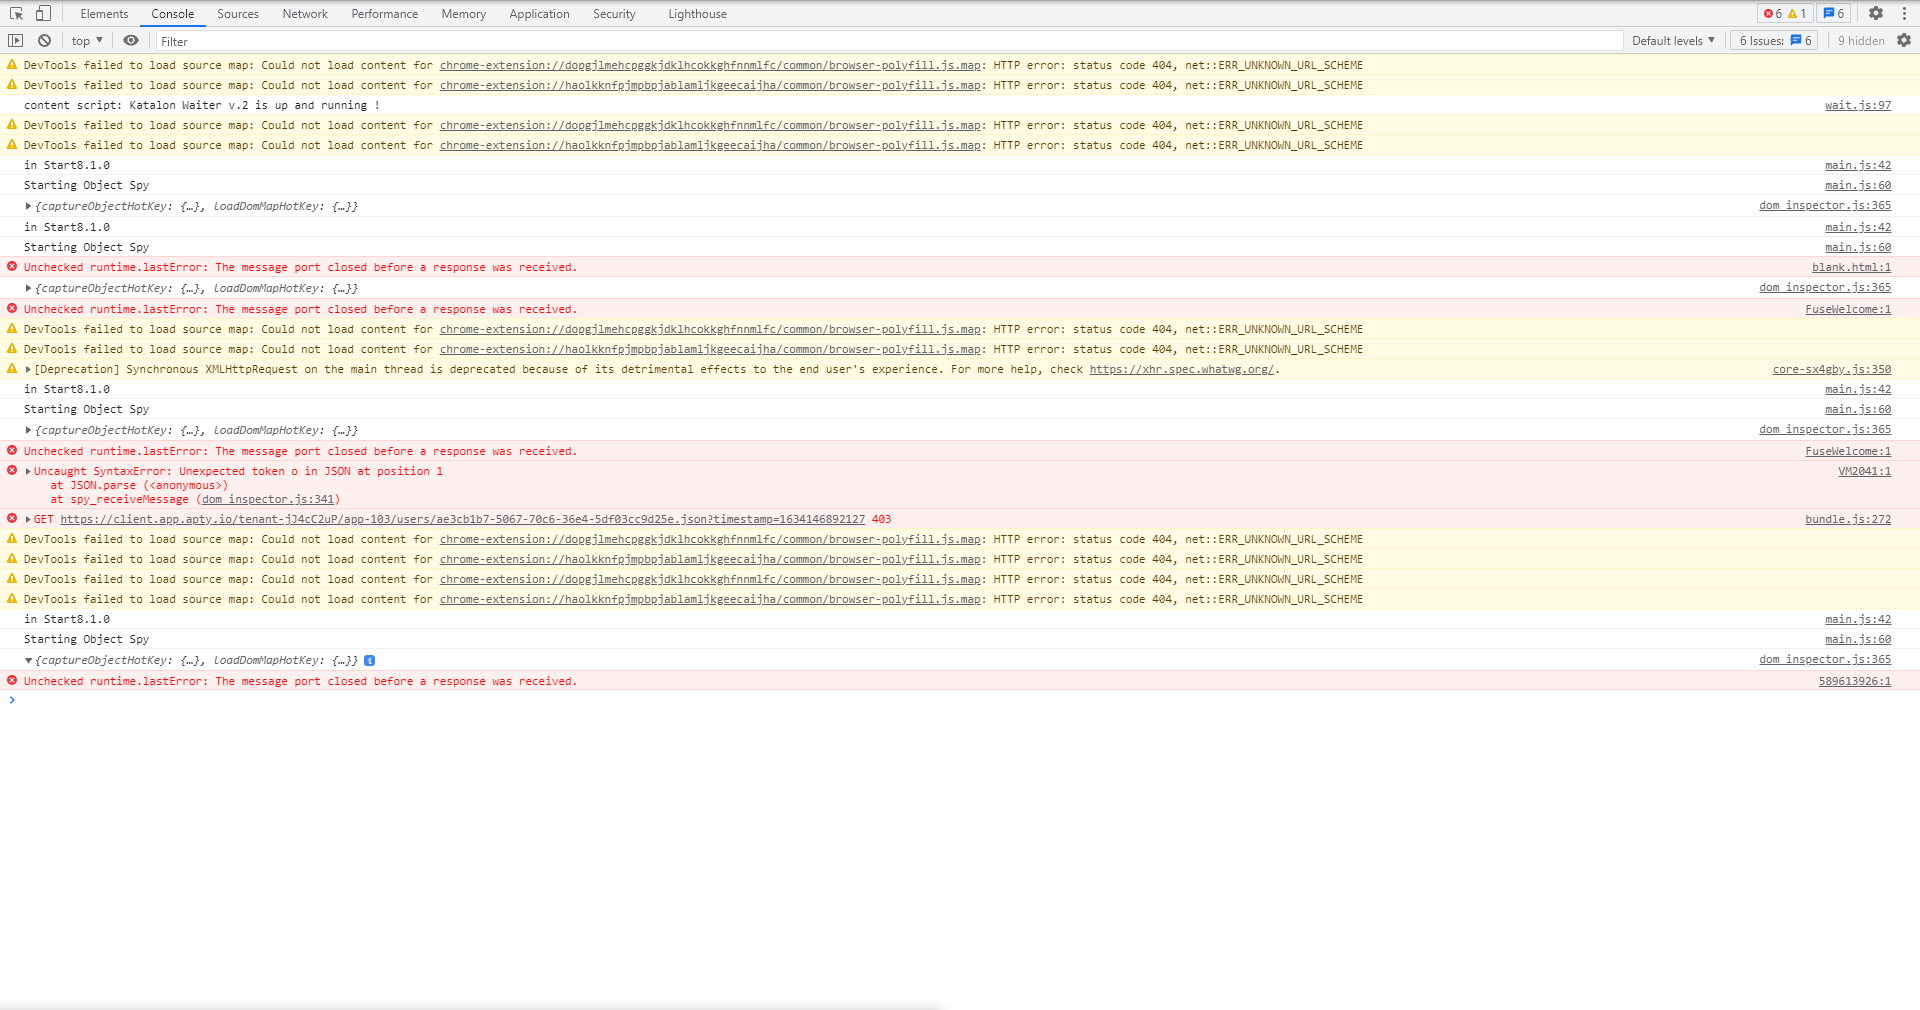
That was within Katalon. Below is the browser console errors when viewing outside of Katalon, on chrome. I will try Firefox in a bit and report back.
This may be caused by an extension running in Chrome:
https://duckduckgo.com/?t=ffab&q=unchecked+runtime.lasterror&atb=v267-1&ia=web
The question now is, are you using any addons/web extensions in Chrome (even if they’re supplied by Katalon)?
I suspect it’s going to work in Firefox…
Shout out to these guys: @duyluong @ThanhTo
Thanks @Russ_Thomas! One additional question: aren’t extensions disabled when executing test cases in Selenium? If not, can they be disabled automatically via a setting?
Fixed?
And how was Firefox?
I don’t know that for sure, but I always assumed they were (they definitely are not present in my Firefox testing - clean fresh profile every test case launch). But you’re dealing with Chome… we’re waiting for the great Chrome-guru in the sky to show up (@Brandon_Hein) 
Also, that text is not rendering in firefox either.
My guess at what’s happening here is that your company uses a managed version of Chrome, where certain settings are automatically set which allow sharing of Diagnostics. Katalon (and by extension selenium) on the other hand spins up a browser with all default settings.
I would get in contact with your IT guy/department and outline the problem with them. They may know which chrome setting is allowing that Diagnostics link to become available.
That link is being displayed based on user security within our enterprise application, Oracle HCM Cloud and should not have anything to do with Chrome settings. Some users have “elevated access” to see this an other admin type links, while lower level employees do not see this link.
Even in incognito mode, I still see the link, just not while automation is happening.
With all that said though, I will reach out to our infastructure team to see if they can provide what settings they are controlling, because you are right that Chrome is being managed by my organization.
I guess I could really get a definitive answer to if the chrome browser is the culprit by downloading Katalon on my personal computer and seeing if it shows up!
@Brandon_Hein
On my personal computer, I do not see the diagnostics link when using spy object so I think we can rule out company managed chrome version.
The diagnostics link is only 1 of a handful of links that aren’t appearing when using Katalon’s browsers.
To be clear, they’re your browsers. And, a gentle reminder, among thousands of users, you are the only person reporting this problem.
To be clear 2, that console message is caused by an addon/plugin as documented in the links I posted above.
This does not explain why I’m able to see those links outside of Katalon, using the same Chrome browser with the same plugins installed.